The FIPEST Report

The FIPEST Report

Share this post

The FIPEST Report
The FIPEST Report
200-Day Moving Average

200-Day Moving Average

Apr 9, 2024

David Brady's avatar
David Brady
Apr 09, 2024
∙ Paid
65

Share this post

The FIPEST Report
The FIPEST Report
200-Day Moving Average
20
Share

This chart shows how extended the Gold price is relative to its 200-Day Moving Average:

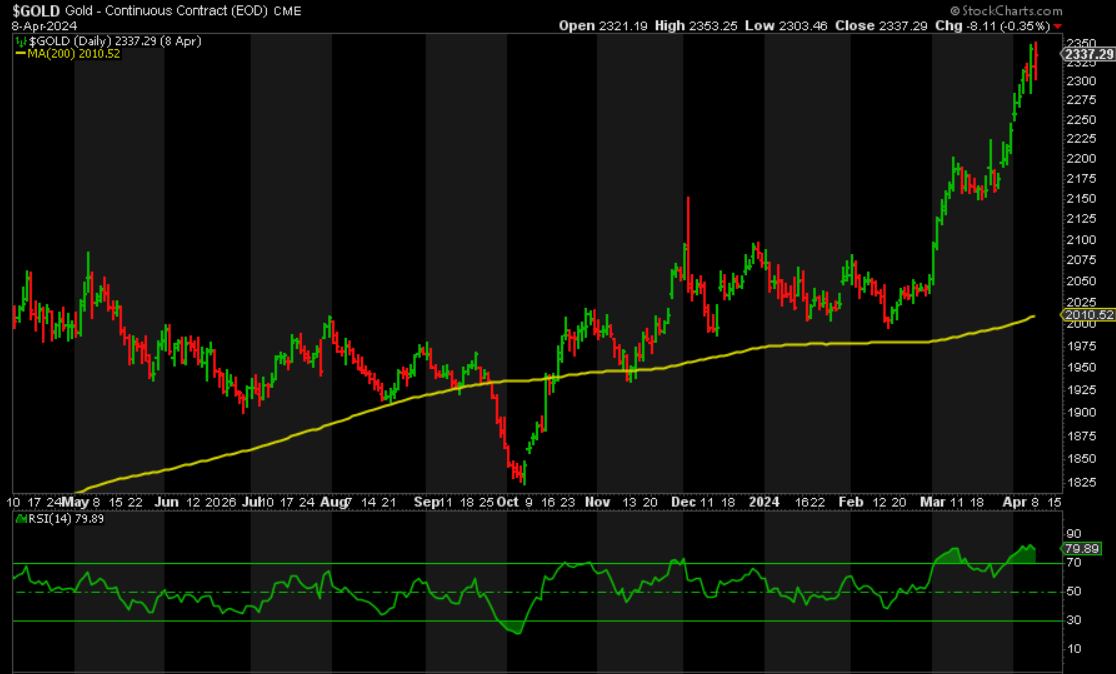
Typically, when the price gets too far away from its 200DMA, it corrects lower. You can see this on the chart be…

Keep reading with a 7-day free trial

Subscribe to The FIPEST Report to keep reading this post and get 7 days of free access to the full post archives.

Already a paid subscriber? Sign in
© 2025 David Brady
Privacy ∙ Terms ∙ Collection notice
Start writingGet the app
Substack is the home for great culture

Share